The purpose of this lab is to build our understanding and increase our skill for using the query function within ArcMap. In this lab we will be preforming multiple criteria attribute queries, along with spatial queries. I will be using the information from the in class lectures and Tutorial 6 of our textbook Mastering ArcGIS to complete this lab assignment.
Methods
Part 1.
Question 1. For this part of the lab we were instructed to use data that was downloaded from our textbook cd. We were to import the counties feature from the USA geodatabase. I then had to preform a query that would return the counties with a population between 3000 and 4000 people in 2010 and also all counties in 2010 that had a population density of at least 1000 persons per square mile. The multiple criteria query that I came up with looked like the following, POP2010>= 3000 AND POP2010<=4000 OR POP10_SQMI>=1000. I was then instructed to create a map showing the counties that fulfilled the criteria of the query. I added a neatline w/background, title, legend, north arrow, scale, and my name to the finished product.
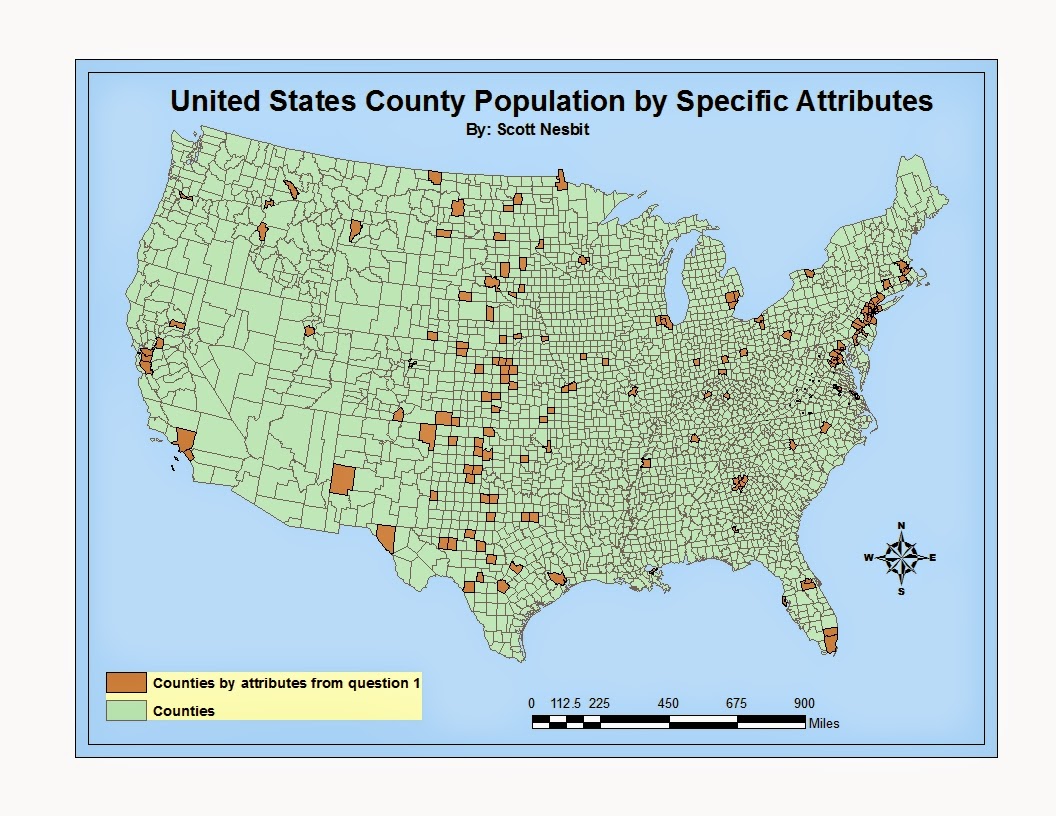 |
| Question 1 Map |
Question 2. For this question I was instructed to use the same data as question 1. I was instructed to create a query that would return county records for Wisconsin, Texas, New York, Minnesota, and California where the male population was greater than the female population and also for these states, the counties where the population of seniors (age 65 and above) is over 6,500. After clearing the search from the previous question I created a multiple criteria query which appeared like the following,STATE_NAME IN ( 'Wisconsin', 'Texas', 'New York', 'Minnesota', 'California') AND MALES > FEMALES AND AGE_65_UP >6500. I was then instructed to create a map showing the counties that fulfilled the criteria of the query. I added the same features as question 1 to the finished map.
 |
| Question 2 Map |
Question 3. Question 3 had me add additional parameters to the query in question 2. I was instructed to add the counties from Washington, Maryland, Illinois, Nebraska, District of Columbia, and Michigan that contained a population of seniors greater than 6500 that reside in counties with more than 30,000 housing units. The query I created looked like the following, STATE_NAME IN ( 'Wisconsin', 'Texas', 'New York', 'Minnesota', 'California') AND MALES > FEMALES AND AGE_65_UP >6500 OR STATE_NAME IN ( 'Washington', 'Maryland', 'Illinois', 'Nebraska', 'District of Columbia', 'Michigan') AND AGE_65_UP>0 AND HSE_UNITS>30000. I was then instructed to create a map showing the counties that fulfilled the criteria of the query. Like the previous maps, I had the same additional feature to complete the map.
 |
| Question 3 Map |
Part 2.
Question 4. For the second section of this lab we were instructed to download data that was provided to us from our instructor. Question 4 asked me to create a query that would return cities in Wisconsin with a 2007 population between 15,000 and 20,000 people, area of the city that is at least 5 square miles in land area, and also where the female population is greater than the male population and lastly the cities must be within 2 miles of a lake. I imported the Wisconsin, cities, and lakes shapefiles from the data I had downloaded. I create a query to extract all of the counties that met the criteria with the exception of being withing 2 miles of a lake. That query looked like the following, ("POP2007" >= 15000 AND "POP2007" <= 20000) AND "AREALAND" >=5 AND "FEMALES">"MALES". Using the cities that were selected from the query I then used a spatial query to return those cities that were within 2 miles of a lake. I was then instructed to create a map displaying the cities that were returned from the query. I was instructed to add the Roads shapefile for display purposes to my final map. The original files were in NAD 1983 UTM ZONE 15N projections and the map was tilted off center. To create a more visually appealing map I decided to change the projection to NAD 1983 StatePlane Wisconsin Central FIPS 4802. I first changed the data frame to StatePlane projection and then I projected all the layers to the same projection for the best accuracy. I also added the same additional feature to the final map as the previous questions.
 |
| Question 4 Map |
Question 5. For this question I was instructed to calculate the total length of a list of rivers that was given to me. I created the following query to select the named rivers, "PNAME" IN ( 'CHIPPEWA R', 'EAU CLAIRE R', 'EMBARRASS R', 'FISHER R', 'HUNTING R', 'KINNICKINNIC R', 'MAUNESHA R', 'MILWAUKEE R', 'MOOSE R', 'NAMEKAGON R', 'PELICAN R', 'PLATTE R', 'POTATO R'). After selecting the rivers through the query I created a new feature that contained only the selected rivers. In the attribute table I created a new field to calculate the length of the rivers. Using the field calculator function I calculated the length of the rivers to the nearest mile per the instructions. Using the summarize feature in ArcMap I was then able to calculate the total length of the rivers that were selected. I was then instructed to create a map that included the major roads and lakes as a backdrop for the map. This map was in the same projection as the question 4. I projected in the same as I did the map for question 4 to make it more visually appealing. I again added the same additional feature to the final map.
 |
| Question 5 Map |
Sources
Price, M. (2014). Mastering ArcGIS (Sixth ed., pp. 9-326). New York, NY: McGraw-Hill.
Data used was given to me in a zip file and downloaded to my computer. Available upon request with the permission of my instructor.
Data used was given to me in a zip file and downloaded to my computer. Available upon request with the permission of my instructor.
No comments:
Post a Comment